Do not diagnose a product from one falling line
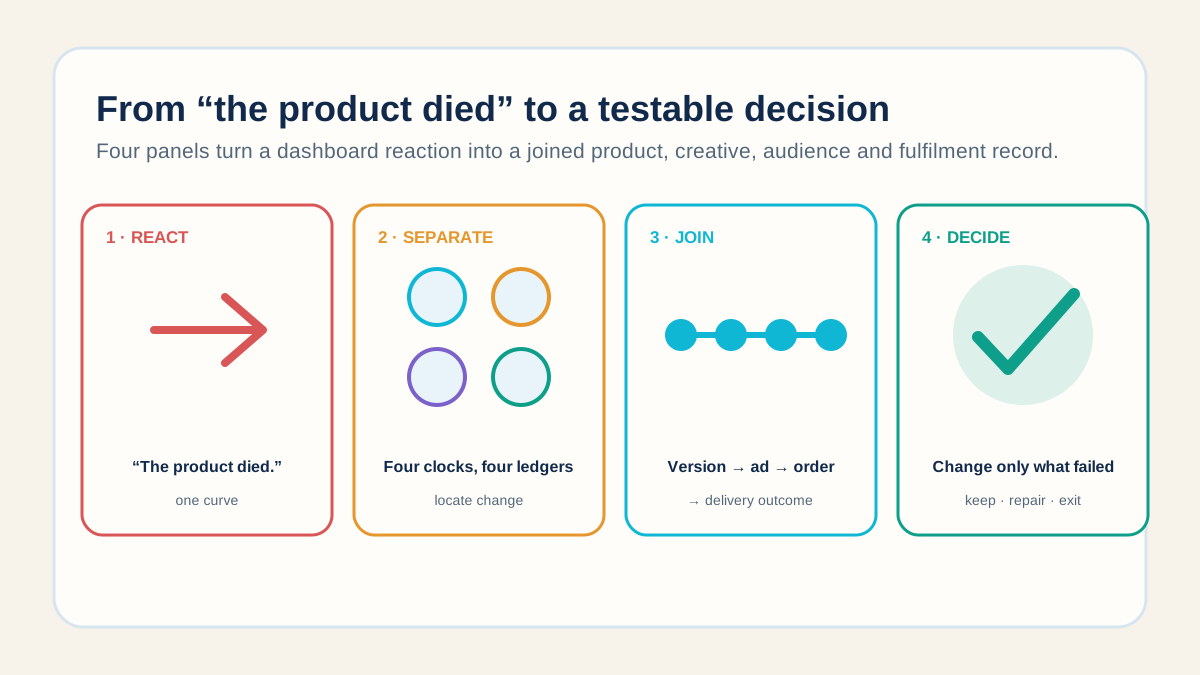
A winning SKU slows. The team says the product is saturated, the media buyer says the creative is tired, the supplier says stock is fine, and the dashboard shows only that orders fell. Four different systems have been compressed into one curve. Acting on that curve alone can kill a sound product, preserve a broken version or send more spend into an operational problem.
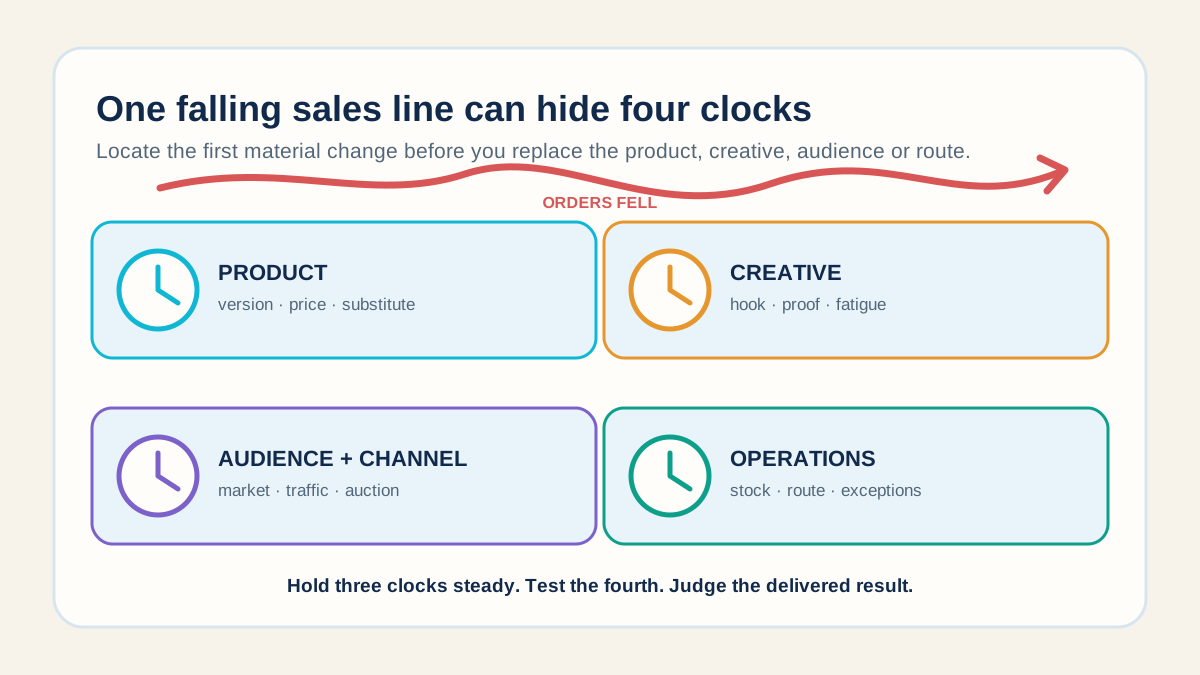
The first decision is not whether to find a new winner. It is which clock changed: the product, the creative, the audience and channel, or the operation after the click. Hold the other clocks as steady as the business safely can, run the smallest test that could prove the preferred explanation wrong, and judge the result after fulfilment rather than at checkout.
This is the diagnostic layer beneath the broader demand-system test. That guide asks whether a product is building durable demand. This one answers the immediate early-scaler question: what actually weakened this week, and what should change next?
What the RyanFulfil order cohort can—and cannot—show
A privacy-safe review of 145,005 unique store-order IDs across 141 store labels, observed from 1 May to 14 August 2026, found that 62.0% of store-order volume came from single-hero or hero-led narrow stores. Under a rules-based recent-activity classification, 48.8% of historical volume sat under labels marked declining or paused/collapsed in the latest comparison window.
Those figures identify exposure, not cause. The export does not contain a complete join to ad spend, sessions, creative IDs, supplier changes, every cost, every refund or every delivery outcome. A store label can slow because a campaign paused, a launch ended, stock ran out, the store migrated, seasonality changed or an operator deliberately rotated attention elsewhere. The 48.8% figure is therefore a triage signal—not a business-failure rate and not an estimate of product half-life.
The operational implication is still useful. When most volume sits in hero-led systems, a mistaken diagnosis is expensive. The seller needs records that separate the clocks before the next decline arrives.
Clock one: did the exact product weaken?
Product decay means the approved customer-ready unit, at its current price and use case, has become less compelling or less acceptable. Look for a stable fall across several credible creatives and comparable audiences while the supplier version, availability, route and measurement remain controlled. Also check whether a substitute became easier to buy, a seasonal job ended, reviews exposed a limitation, or the offer lost its price advantage.
- Product evidence: conversion by exact SKU and version, price and offer, review and support themes, refund reasons, second-purchase or referral behaviour, and competitor or substitute changes.
- A stronger signal: new creative angles continue to earn qualified attention, but comparable visitors buy or keep the order less often.
- A falsifier: the same approved version regains delivered contribution with a new angle, audience or market while the other clocks stay stable. That result weakens the "product is dead" story.
Do not merge a factory substitution into this clock. A changed material, component, finish or package is a new version and should reopen supplier and factory change control. Otherwise the team may blame demand for a product it never approved.
Clock two: did the creative stop teaching or persuading?
Creative fatigue is narrower than falling sales. It appears when comparable auction and store conditions hold, response to a specific message or execution weakens, and a materially different but truthful angle restores qualified behaviour. Recolouring the same opening or producing fifty cosmetic variants is not a new hypothesis.
Kuaishou reported that spending on AIGC short-video marketing materials grew by more than 70% year over year and that more than 850,000 merchants used its free AI business tools in the first half of 2026. Those are Kuaishou ecosystem figures, not a Shopify benchmark and not evidence that AI caused faster fatigue. They establish a narrower competitive direction: producing more creative is becoming easier, so the useful asset is the learning captured from each test.
- Tag the hypothesis, not only the file: hook, customer problem, mechanism, proof, objection, identity, offer and product version.
- Define the metric each variation is meant to move. An opening can test attention; a demonstration can test belief; the order and delivery record test commercial truth.
- Measure learning yield: the number of validated, reusable findings divided by creatives produced. A large output with no decision attached has low yield.
When this clock is the likely problem, use the three-proof short-form product test. The new angle must demonstrate a fact the exact shipped unit can support; higher clicks built on a false expectation are not recovery.
Clock three: did the audience or channel change?
The product and creative can remain credible while the people, placements or economics reaching them change. CPM can rise. A broadening audience can click cheaply and convert poorly. One country can enter a seasonal lull. Attribution settings, consent behaviour or missing events can make the same store look weaker than it is.
- Hold the creative, page, price and product version steady; compare market, audience, placement, device, campaign structure and attribution settings.
- Read counts beside rates. A dramatic movement from a small cohort should narrow the next test, not create a confident story.
- Check the location of the loss: impressions to outbound click, click to landing-page view, visit to checkout, checkout to purchase, then purchase to delivered contribution.
If the symptom is higher acquisition cost, use the Meta CAC decomposition to separate auction price, response, store conversion, measurement and order economics. "Creative fatigue" should be the conclusion of that trace, not its starting label.
Clock four: did the operation make the winner look tired?
An operations clock starts after demand appears but can damage every upstream metric. A hero variant goes out of stock, the supplier processing time grows, the factory ships a subtly different version, a heavier package changes landed cost, the route slows, usable tracking arrives late, or refunds and reships rise. Checkout revenue may hold while realised contribution disappears. Conversion can later fall because the store changes its delivery promise, removes a popular variant or accumulates weak reviews.
- Product control: approved version, sellable stock by exact SKU, confirmed inbound, first-changed-batch evidence and replenishment time.
- Order flow: cancellation and address cut-offs, variant mapping, processing distribution, carrier handover and usable tracking return.
- Mature outcome: delivered non-refunded revenue minus product, China movement, checking and packing, freight, payment, ads, refunds, reships, chargebacks and attributable support.
Keep forecast, paid demand and physical stock separate with the demand-to-stock bridge. A campaign pause caused by missing stock is not product decay, and a total stock count is not proof that the selling variant is available.
Use the symptom-to-clock matrix
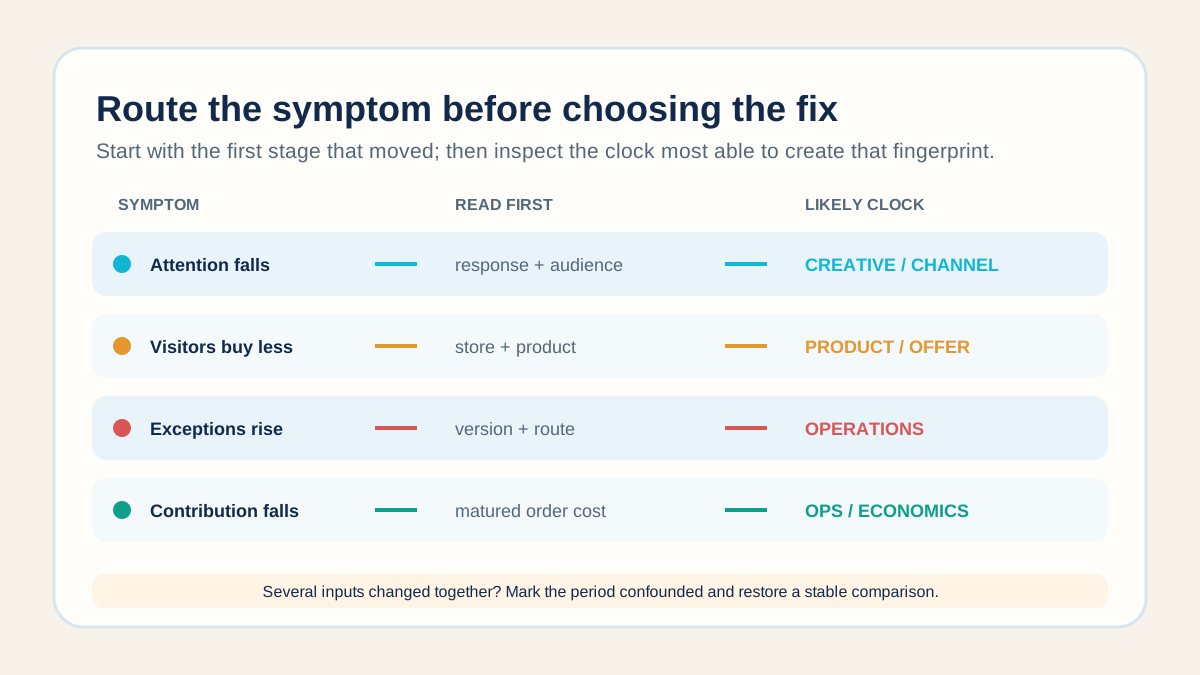
- Attention falls; qualified conversion and delivered contribution hold: investigate creative response and audience mix first.
- Attention holds; comparable visitors buy less: investigate offer, page, exact product, price, variant availability and trust.
- Purchases hold; cancellations, refunds or reships rise: investigate the approved version, promise, route and exception causes.
- Purchase CAC holds; realised contribution falls: investigate product cost, packing, freight, discounts and exception reserve.
- Every stage moves after several inputs changed: label the period confounded. Restore a stable comparison before choosing one cause.
The matrix is a queue, not a verdict. Several clocks can move together. A stronger hook may attract a colder audience; a stockout may force a weaker variant; a route change may coincide with a price promotion. Record the overlap rather than forcing a single-cause story.
Did the need fade, or did another format take the sales?
A falling exact unit can also mean customers still want the same job done but now buy it in an adjacent shape, size or material: a narrower case than a substitute becoming easier to buy. Read as product decay, that case sends you after a new product for a need that has not gone.
- The need faded: several formats and creatives weaken together. Check search and customer evidence across the substitutes that do the same job, not only your own SKU.
- The format lost: an adjacent shape, size or material wins sales for the same job while your exact format falls. Check whether search and substitute evidence for the job hold steady while your format alone weakens.
Your format weakening proves nothing about the adjacent one; it still has to pass fit, rights, a quality check on the sample in hand and delivered cost. Record the exact models that are winning, with their dimensions, material, included parts and care, and do not copy another brand's protected design, material claims or use instructions.
A supplier photo cannot settle fit in use, so the next step is a sample and a preference test before any stock is committed. Write the sample brief first: the version, the setting it will be used in, your current format as the baseline, the same use repeated on both, what to record and the result that drops the idea.
In the preference test, assign each visitor who reaches the product page, at random, to see either your current format or the adjacent one, at the same price and delivery promise and from the same ad, so price and creative cannot explain the result. Compare all purchases of both formats and all costs per assigned visitor, so a sale that only moved from the old format is not counted as new demand. Fix one outcome window for both groups before launch, long enough to include delivery and refunds. If the adjacent format wins, size the first stock commitment to the orders the test window produced, not to a forecast.
Run a seven-day falsification sprint
- Day 0—write the claim: "We believe the decline began in [clock] because [observable evidence]. We will reject that explanation if [specific result]."
- Freeze the reference: exact product version, price, page, market, audience definition, attribution setting, route, delivery promise and stock state.
- Choose one meaningful intervention in the suspected clock. Do not change the hook, price, market and supplier at the same time.
- Set a decision-quality minimum using counts, risk and available contribution. If the store cannot afford enough evidence, narrow the cohort or extend the test; do not invent a universal conversion threshold.
- Wait for the metric that decides the claim. Creative response can mature quickly; refunds, reships and delivered contribution require a later cohort review.
- Record keep, revise, hold or exit. Include the result that would trigger the next state so the team does not repeat the same test after memory fades.
Seven days is an operating cadence, not a promise that every product can be diagnosed in a week. Use a longer window for sparse traffic, long delivery routes, seasonal demand or outcomes that have not matured. The point is to pre-write the decision and prevent an endless series of uncontrolled edits.
Give every clock a stable join key
A learning loop fails when the ad team names a creative "final-v7", the store uses a product title, the supplier uses a listing link and the warehouse uses another SKU. The records cannot meet, so the loudest dashboard becomes the explanation. Create simple identifiers that survive the handoff.
- Product: canonical SKU, approved version and supplier/factory version date.
- Creative: creative ID plus hypothesis tags for hook, proof, objection and offer.
- Audience/channel: campaign, market, placement, cohort dates and attribution setting.
- Operation: route, packed weight, stock state, processing cohort, delivery outcome and exception reason.
- Commercial result: order ID joined to non-refunded revenue and every variable cost available at the chosen maturity date.
The record does not need to begin as a perfect data warehouse. A disciplined export with stable keys and definitions is better than an elaborate dashboard that cannot join the shipped version to the creative promise. Start with the hero SKU and the decision that currently costs the most.
Decide the next state before emotion decides it
- Keep: delivered contribution remains above its floor and no material clock has weakened.
- Refresh creative: response weakened under comparable conditions, while product truth, store conversion and operations remain credible.
- Change audience or channel: the same product and creative remain sound, but traffic quality, auction economics or market fit changed.
- Repair operations: purchases remain credible, but stock, version, route, delivery or exception cost broke the result.
- Harvest: acquisition no longer supports broad scale, but a controlled segment, direct demand or existing customer path remains profitable.
- Exit: the approved product fails a safety, rights, product-truth or realised-contribution gate, or repeated controlled tests cannot restore a viable cohort.
If the hero still has a viable customer and operating system but needs a next offer, use the adjacent-SKU interview. Do not make random catalogue expansion the treatment for an undiagnosed decline.
Read all four clocks before killing the SKU
RyanFulfil cannot decide whether an ad angle deserves more spend. We can make the operations clock inspectable: exact-version sourcing, sample and first-batch comparison, sellable and incoming stock visibility, customer-ready packing, route and packed-cost quoting, controlled live orders, tracking handoff and exception evidence. That lets the merchant test product, creative and audience explanations without an invisible China-side change contaminating the result.
Send the exact product reference, approved version, main variants, target markets, current order stage and the clock you are trying to test. Services shows the China-side work we can own; Pricing shows what belongs in the customer-ready cost. The useful first action is usually a narrower hold, check or controlled order—not a claim that every slowing product can be rescued.
What these figures can and cannot show
The RyanFulfil figures are aggregated from 145,005 unique store-order IDs across 141 anonymised store labels observed from 1 May to 14 August 2026. Store labels are operational labels, not necessarily distinct legal merchants. The export is strong for concentration, units and recent-activity triage, but it lacks a complete ad, session, cost, return, chargeback, support and delivery join. Recent-activity classes do not establish failure or product decay, and observed behaviour in this 106-day window is not lifetime retention.
Kuaishou's AIGC-spend and merchant-tool figures are company-reported ecosystem observations. They do not describe independent Shopify stores, establish causality or predict creative performance. Use the four-clock model, symptom matrix, falsification sprint and learning-yield measure to organise evidence and decisions; they do not guarantee sales, advertising performance, delivery outcomes or profit.
Need a product checked before you spend on ads?
Send us the product link and destination on WhatsApp (+86 178 4666 9989). We'll check sourcing, packing and shipping with you before you commit.
Get Sourcing Quote on WhatsApp →