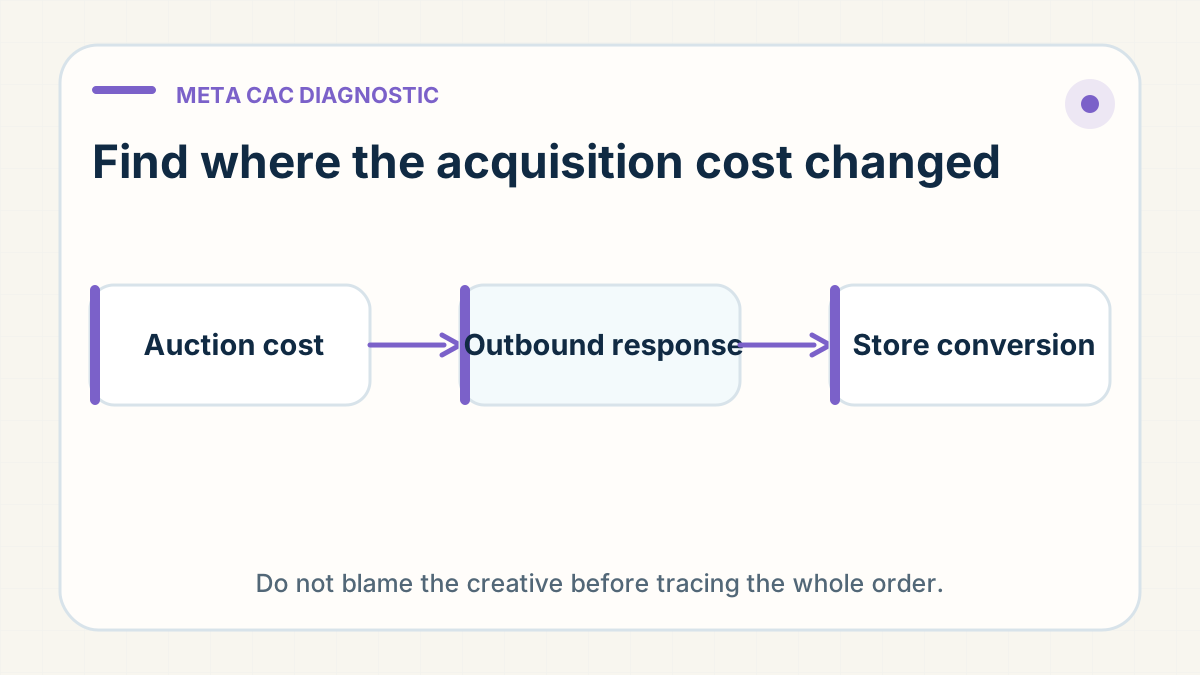
CAC has three mathematical parents and one commercial judge
Customer acquisition cost can rise because impressions became more expensive, fewer people clicked each impression, or fewer visitors purchased after the click. The order then faces a fourth test: did enough contribution remain after product, fulfilment and exceptions? Calling every increase "creative fatigue" skips three of those four places.
The useful first answer is therefore a decomposition, not a new hook. For a simple click-to-purchase funnel, purchase CAC can be expressed as CPM divided by 1,000, outbound click-through rate and purchase conversion rate. Use rates as decimals. This is an identity for diagnosing the observed funnel, not a forecast that assumes every impression, click or attributed purchase is equivalent.
The same CAC increase can have three different causes
Consider an illustration with a $15 CPM, 1.5% outbound click-through rate and 2.5% purchase conversion rate. One thousand impressions cost $15, produce 15 outbound clicks and yield 0.375 attributed purchases. The implied purchase CAC is $40.
- If CPM rises to $18 while the two rates hold, implied CAC becomes $48. The ad and page did not weaken in this illustration; the impression became more expensive.
- If outbound CTR falls from 1.5% to 1.2% while CPM and conversion hold, implied CAC becomes $50. The loss appears before the visit.
- If purchase conversion falls from 2.5% to 2.0% while CPM and CTR hold, implied CAC also becomes $50. The same dashboard outcome now points after the click.
A $50 CAC cannot tell you which of those occurred. The formula can. That is why replacing the creative first is not decisiveness; it is changing a visible input before locating the failure.
Meta Q2 makes the diagnosis more important, not automatic
Meta reported that Family of Apps ad impressions increased 14% year over year in Q2 2026 while average price per ad increased 12%. More ad supply did not coincide with a lower company-wide average price. Those figures are platform aggregates across products, markets and advertisers. They are not a store benchmark, not the same thing as one account's CPM, and not evidence that Meta caused a particular seller's CAC increase.
The narrower implication is useful: an operator should not assume that expanding platform inventory will make acquisition cheaper. Meta is improving delivery systems while advertisers compete for outcomes. Your account still has to show where its own cost moved—auction, response, conversion or order economics—using a consistent attribution setting and comparable cohorts.
Build four ledgers before writing the story
- Auction ledger: spend, impressions, CPM, market, placement, audience and dates.
- Response ledger: outbound CTR, outbound clicks, landing-page views and cost per landing-page view.
- Store ledger: product-page view, add-to-cart, checkout and purchase rates, segmented by product and market.
- Delivered-order ledger: revenue, product and fulfilment cost, cancellations, refunds, chargebacks, reships and delivered contribution.
Keep counts beside rates. A conversion rate built from 20 visits should not carry the same confidence as one built from 2,000. Keep attribution windows, currency, market, offer, product version and major promotions consistent where possible. If several changed together, record the result as confounded instead of choosing the explanation the team already prefers.
Do not turn 50 conversions into a law of nature
The old draft used roughly 50 weekly optimisation events as a universal budget formula. That can create false precision. Current Meta guidance is more useful operationally: performance is less stable during learning, similar ad sets can fragment opportunities, significant edits can restart learning, and consolidation may help the system learn faster. Ads Manager's actual delivery status belongs in the audit; a recycled threshold should not overrule the account in front of you.
A small store should not multiply target CPA by 50 and conclude that it must spend money the product cannot safely repay. First simplify unnecessary fragmentation, choose an optimisation event that matches the commercial goal, avoid constant edits, and decide whether the available budget can produce a decision-quality test. Insufficient evidence is a reason to narrow the test—not permission to manufacture certainty with a bigger spend.
Check whether the measurement path broke
A falling reported conversion rate can reflect a weaker store, a tracking break or both. Compare outbound clicks with landing-page views, test purchase events, check duplicate or missing events, and confirm that the same attribution setting is used across periods. Meta describes Conversions API as a way to create a more reliable connection for website and later customer-journey events, often alongside the pixel. It is not a way around consent, privacy controls or platform rules.
Measurement repair should precede creative judgment. If checkout purchases exist in Shopify but do not reach the ad dataset consistently, the apparent CAC is partly an instrumentation result. If the events match and the purchase rate still fell, the store or offer deserves investigation.
Read the location of the change
- CPM up; outbound CTR and purchase conversion stable: investigate auction, market, placement, seasonality and audience mix before rewriting the claim.
- Outbound CTR down; CPM and post-click conversion stable: investigate the message, first frame, audience fit and creative fatigue.
- Clicks stable; landing-page views fall: investigate page speed, broken links, redirects, consent flows and accidental traffic.
- Landing-page views stable; purchase conversion falls: investigate price, offer, trust, variant availability, payments, delivery promise and page-to-product consistency.
- Purchase CAC stable; delivered contribution falls: investigate product cost, parcel cost, discounting, refunds, reships and order quality. The ad may be innocent.
These are investigation routes, not automatic verdicts. Mix shifts can move several rates at once, and a stronger creative can attract cheaper clicks that convert worse. Follow the whole path rather than optimising one percentage in isolation.
Give creative a fair, bounded test
When the response ledger points to creative, test one meaningful message change against a stable product, page, market and offer. Use the three-proof short-form product test so the new hook demonstrates an attribute the approved unit can actually support.
A higher click-through rate is not a win if the message creates an expectation the product cannot meet. Check every outcome or comparison against the defensible product-claims guide, then measure purchases and delivered outcomes rather than stopping at clicks.
Calculate the CAC ceiling from the delivered order
The ad dashboard reports what was paid to acquire an attributed purchase. It does not decide what the store could afford. A practical first-order CAC ceiling begins with order revenue, subtracts every variable cost other than acquisition, then subtracts the contribution the business needs to retain.
For example, a $60 order with $14 product cost, $10 fulfilment and freight, $2 payment cost, $4 expected refund and reship cost, and an $8 target contribution has a maximum first-order CAC of $22. A $20 dashboard CAC appears acceptable. If late exceptions add $5 per order, it is not. The delivered order judges the acquisition result.
Do not ask a vague future repeat purchase to rescue the ceiling. Use the first-order margin and realised-LTV framework when mature cohorts support a repeat mechanism. If the plan is to lift the basket, first check whether higher AOV is hiding weaker cart economics.
Pre-write the next decision
- Keep the current setup when delivered contribution remains above its floor and no material stage has weakened.
- Change creative when response weakened under a comparable auction and the product, offer and measurement path remain credible.
- Change the page or offer when qualified visits hold but purchase progression weakens.
- Change the operation when purchases hold but cancellations, fulfilment cost or post-delivery exceptions consume the margin.
- Narrow or pause when the evidence is too sparse, several major inputs changed, or the CAC ceiling cannot fund a responsible test.
Archive the dates, market, product version, campaign structure, attribution setting, creative, page, offer, delivery promise and matured contribution result. Without that record, the next team member will see one higher number and repeat the same creative reset.
Change the part of CAC that actually failed
A rising CAC is a symptom. Decompose it into impression cost, outbound response and post-click conversion, then judge the attributed purchase against delivered contribution. Use the account's real learning status and event quality instead of forcing a folklore threshold onto every budget.
The ad gets blamed because it is the part everyone can see. But CAC is where the auction, message, store and operation leave fingerprints. Do not fire the creative for a crime committed after the click.
What these figures can and cannot show
The Q2 2026 impression and average-price figures are Meta-reported company-wide observations. They do not describe a particular account, establish why ad prices changed or predict a store's CPM, CAC or sales. Meta's learning, account-simplification and Conversions API pages describe its current product guidance; performance claims on those pages are Meta's own. Use the decomposition, delivered-CAC ceiling and decision rules to examine your own account; they do not guarantee ad performance, attribution accuracy, conversion or profit.
Need a product checked before you spend on ads?
Send us the product link and destination on WhatsApp (+86 178 4666 9989). We'll check sourcing, packing and shipping with you before you commit.
Get Sourcing Quote on WhatsApp →