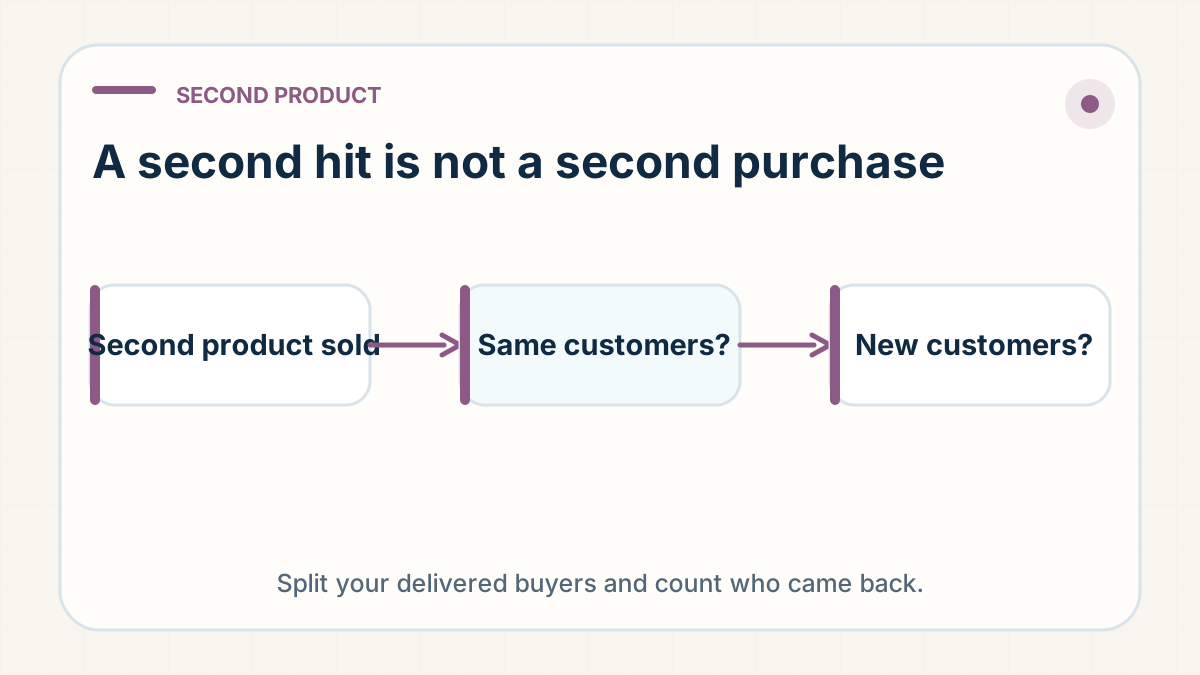
Your second product sold. Find out who bought it.
POP MART grew revenue 23.8 per cent in the six months to 30 June 2026. The Chinese pop-toy company is the one behind LABUBU. One character did most of the work: Twinkle Twinkle, the fastest-growing IP of the group, grew 580.6 per cent and supplied 68.6 per cent of the company's whole increase. THE MONSTERS, the LABUBU family, fell. Nothing in the filing says whether the people who bought Twinkle Twinkle were the people who bought LABUBU. That is the gap that decides what your own second product is worth.
Your second product sold. That tells you it can sell. It does not tell you who bought it, and that is the number your next decision rests on. If the same people who bought your first product came back for the second, you have customers. If strangers bought it from a new ad, you have a second product and the same ad bill. If your first product's buyers moved over to it, you may have swapped one hit for another and grown nothing. A sales table cannot tell those apart. This guide gives you a way to find out for your own store: a week of work with your order list, which answers who bought it, and then a test with a wait attached, which answers whether the range is worth building for them.
It follows on from the winning product is only the surface, which explains why demand you have to buy again from the same ad auction is rented. This guide is about the one moment that decides whether you own any of it: the second purchase, and who made it.
What POP MART's numbers do and don't tell you
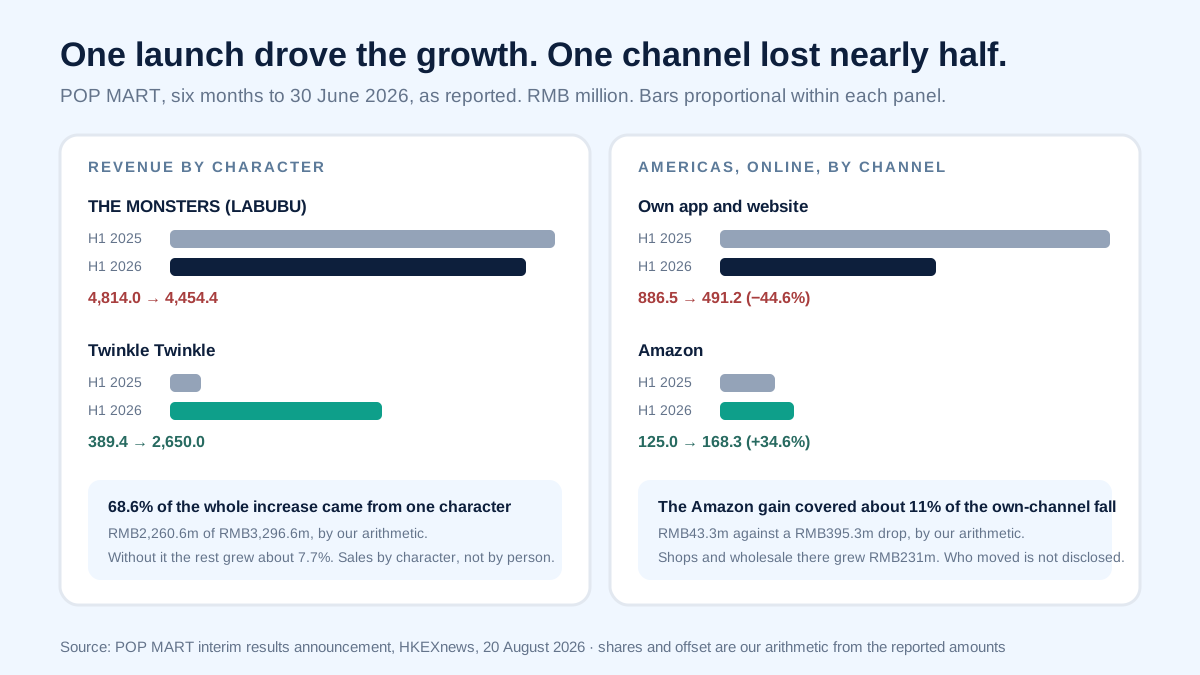
POP MART's interim results for the six months to 30 June 2026 report revenue of RMB17,172.9 million, up 23.8 per cent. Inside that, its Twinkle Twinkle character went from RMB389.4 million a year earlier to RMB2,650.0 million, while THE MONSTERS, the LABUBU family, went from RMB4,814.0 million to RMB4,454.4 million.
The reported amounts show Twinkle Twinkle added RMB2,260.6 million, or 68.6 per cent of the company's RMB3,296.6 million increase. Removing Twinkle Twinkle from both years leaves the rest of the business up about 7.7 per cent. One way to read the headline is one launch. Another is one format: plush rose from RMB6,139.2 million to RMB9,824.9 million, a rise larger than the total increase. Both readings use sales tables by product, not lists of people.
That distinction is the whole point. A sales table shows you what sold. It cannot show you whether the people who bought Twinkle Twinkle this year were the same people who bought LABUBU last year, people who had never bought from POP MART, or LABUBU buyers who moved their spending across. The company does not publish that, and it is the one thing you need to know about your own store.
Three ways a second hit can happen
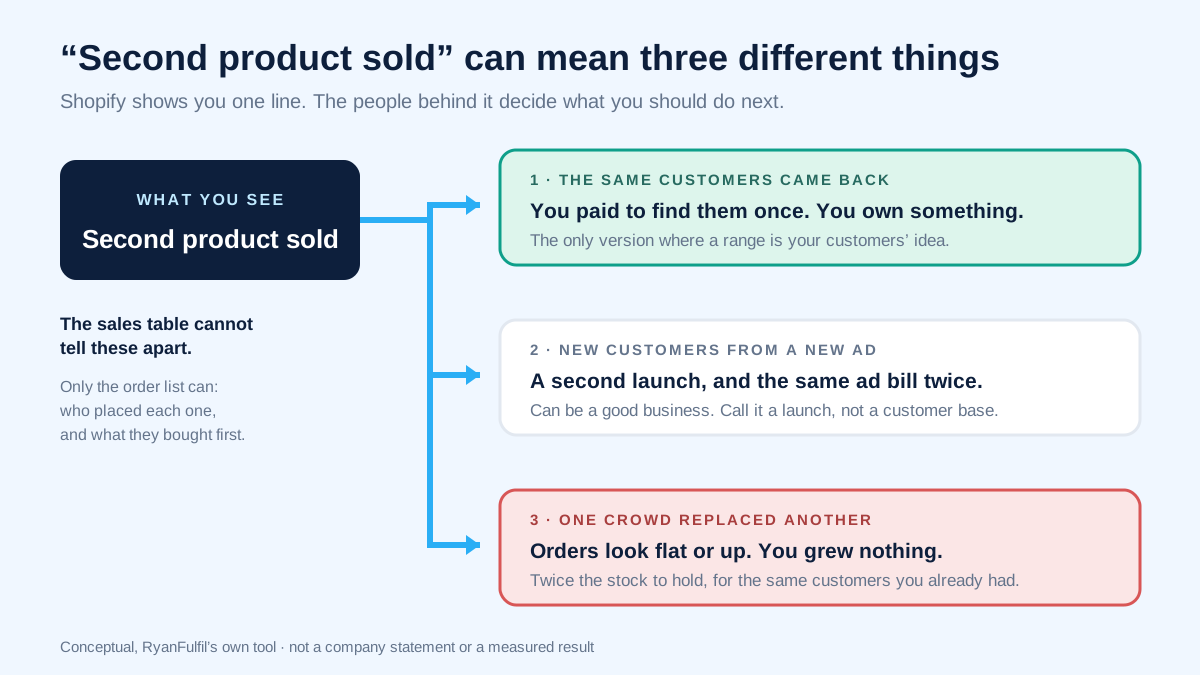
When your second product sells, one of three things happened, and they look identical in Shopify.
- The same customers came back. The people who bought your first product wanted the second one too. You paid to find them once. This is the only version where you own something.
- New customers came in. A new ad found new people, and they bought the second product without ever seeing the first. You have two products and you are paying for every customer twice over. That can still be a good business, but call it what it is: a second launch, not a customer base.
- One crowd replaced another. Your first product's buyers stopped buying it and bought the second one instead. Total orders look flat or up, the range looks healthy, and you have grown nothing while doubling what you hold.
You cannot tell these apart from the order count, the revenue line or the fact that the second product "worked". You can only tell them apart by looking at who placed each order, which is a question about people, not products. And each answer has its own next step. Same customers: the second product has earned the test further down, to see whether a range is worth building for them. Strangers: treat it as a second launch, test its cold economics on its own budget, and do not build a range for repeat you have not seen. One crowd replacing another: hold the range and find out why the first product stopped selling, because a range will not fix that.
A repeat rate is only as good as its definition
POP MART does publish a repeat number, and the winning-product guide already quotes it: sales to registered members were 92.9 per cent of its mainland China revenue, and 51.6 per cent of purchasing members bought twice or more in the half-year, and the footnote defines it: members who bought twice or more in the half-year, divided by all members who bought in the half-year. What matters here is what that number does not say.
It is not the share of all 82.44 million mainland members who came back. It is not a yearly figure. It is not global. And it is not the number you want, because it cannot tell you whether a member's second purchase was a second LABUBU, a first Twinkle Twinkle, or a keyring. A repeat rate says people bought twice. It does not say what they bought the second time, and that is the question your range decision turns on.
Your own version needs to be narrower still. Start with the people whose first order was delivered and whose refund window has passed, so you are counting customers who kept the product. Then record what each of them did next: bought the same product again, bought your second product, bought a small add-on, bought something unrelated, or bought nothing. Keep refunds and cancelled orders in the count. Give recent buyers time; a customer from last week has not had the chance to come back yet.
A strong repeat number can belong to a small group
Bloks, the company behind the Blokees building-figure brand, gives the other half of the warning. Its interim results say that among users who activated its RMB9.9 TRANSFORMERS Defender Version product inside the Blokees Club mini program, 60 per cent were new users, and the repurchase rate of those new users was above 70 per cent. That RMB9.9 range brought in RMB346.9 million from 77.5 million units, or about RMB4.48 per unit, and 89.7 per cent of the company's revenue came through offline distributors.
A repurchase rate above 70 per cent is a striking figure. Look at who it counts. It is people who scanned a product into an app. People who scan in are not the same as people who do not; they are already the keen ones. So the number tells you that keen new buyers came back, which is useful. It does not tell you that scanning caused the second purchase, or anything about the buyers who never opened the app.
There is a cheap version you can run without an app: a landing page for the exact version you sold, with the after-delivery questions, a way to reach you, and the next product when the customer is ready. Count who visited, who agreed to messages, who used it and who paid again, separately. A sign-up is not a sale, and a replacement for a fault is not a second order.
The RMB4.48 matters for a different reason. Bloks sells a RMB9.9 toy through distributors and gets back about RMB4.48 per toy as revenue, roughly half once you allow for the sales tax inside the shelf price. The toy still works for them because a shop puts it by the till. The same toy sent as a single parcel from China, after your ad, is a different offer with different sums, and a cheap price that works next to a checkout can fail on its own with a stranger.
Who bought it: the answer is in your order list
Your Shopify export already holds the answer to the title. Take every delivered order of your first product whose refund window has passed. Match those customers to every later order by customer id first, then by email, then by shipping address, because a guest checkout or a second email address will otherwise look like a stranger. Then put each first buyer in one of five columns: bought the same product again, bought your second product, bought a small add-on, bought something unrelated, or nothing yet.
Now look at your second product's orders from the other side: how many came from people in that list, and how many from people who had never bought from you. That is the three-way split, in your own numbers. Be honest about the gaps. Guest orders you could not match will sit in the "nothing yet" column and make your repeat look worse than it is, so record how many you could not match rather than pretending the column is clean.
The next question needs a test: will they buy the next one?
If the join shows the same customers came back, the question changes: is a range worth building for them, or was the second product a one-off? That needs a test, because the buyers who already came back cannot tell you what the ones who did not will do. Take the delivered first-product buyers who have not yet bought the second product; the join has already told you about the ones who have. Check that every one of them has already agreed to marketing messages, because both halves of the test must be people you may write to. Split them at random into two equal groups, written down before you send anything. Offer the second product to one group. Say nothing about it to the other; both groups still get every safety and support message as normal.
Then wait until refunds have settled, for as long as your delivery route and your product's buying cycle need, and count profit after costs across every order each person placed in that window, whether or not it was the second product. Count it per person you assigned to the group, not per person who opened the email. Take off discounts, shipping, handling, support time and losses, and include the first product's orders, so you see if the second product ate them.
The difference between the two groups is what offering the second product was worth to your existing customers. If it is positive after your setup cost, the second product helped with these customers, in this country. If it is flat, you have just saved yourself a range. A result like this says nothing about whether the second product can win strangers from a cold ad; that needs its own test, with its own budget.
This test needs numbers, and here is the boundary. An illustration, with made-up figures: 1,000 delivered buyers get the offer and 1,000 do not. Over the same settled window, all-store profit after costs is 3,800 dollars for the offered group and 2,900 for the other. The difference is 900 dollars, or 90 cents per person assigned. If the creative and setup cost 600 dollars, the test made 300 dollars net. At a thousand a side, a difference that size is only just bigger than what chance alone would produce. With a few hundred buyers a side, a difference that size is noise, and you should not decide a range from it. Below that, use the order list, skip the split, and run it later when the list has grown.
A week of work, then a wait
- Day one. Pull every delivered order for your first product with the refund window passed. That is your list of real customers.
- Day two. Match them to every later order, by customer id, then email, then address. Record what each bought next, if anything, and when. Count the guests you could not match, separately.
- Day three. Read the answer: same customers, strangers, or a swap, and take the matching next step. Only if the same customers came back does the split make sense.
- Day four. Split the first buyers who have not yet bought the second product into two random groups of equal size, all people you may message. Write the split down, and fix the wait now from your route's delivery time plus your refund window.
- Day five. Send the offer to one group and nothing to the other. Then leave it alone.
- After the window, which on a China route with a thirty-day refund window is six to ten weeks: count profit after costs across all orders per person assigned, both groups, refunds in. Subtract setup. Decide: range, one more test, or stop.
Download the blank second-buyer worksheet. One row is one launch. It has a column for each of the five things a first buyer can do next, the guests you could not match, the two groups and whether they were big enough to decide from, the window you promised yourself, and the profit after costs for each group. Fill in the stop reason before you send the offer, not after.
Your own channel may not hold them either
One more thing from the same filing, for when the join says the same customers came back and you plan to reach them again through your own shop and email list. In the Americas, POP MART's revenue from its own app and website fell 44.6 per cent, from RMB886.5 million to RMB491.2 million, while its revenue through Amazon there rose 34.6 per cent, from RMB125.0 million to RMB168.3 million. Its own shops in the Americas grew 22.5 per cent, its wholesale and other revenue there rose from RMB95.9 million to RMB162.5 million, and its store count went from 41 to 86. In Asia Pacific the own app and website grew 8.1 per cent while Shopee fell 62.1 per cent.
The reported amounts put the Amazon gain at about 11 per cent of the own-channel fall. Growth in shops and wholesale together, RMB231.2 million, would cover about 58 per cent of it if every dollar had moved across, and the filing does not say whether it did. POP MART's explanation for the Americas is that the popularity of its core IPs returned to normal levels and that the traffic and customer-acquisition capabilities of its online channels remain under development. For Asia Pacific it said the benefit from outside traffic to its online channels was fading, and that it had moved from expanding scale to running the channels it has more carefully.
For you the lesson is narrower than "own channels are dying". Your checkout, your domain and your email list are assets only if they bring people back, and a company with an app and tens of millions of registered members still saw its own Americas channel lose nearly half its sales while its hit cooled. When your returning-customer revenue falls, find the cause before you discount everybody.
What to watch and what not to assume
- Watch: whether POP MART reports a customer-level figure for its fastest-growing character at full year; whether Bloks publishes a repurchase window; and what your first launch's customers do in the ninety days after the second.
- Ignore: "POP MART is growing, so sell collectibles"; "blind boxes work, so add one"; and any repeat rate quoted without the two numbers it was divided from.
- Join first and second purchases in your own customer data and use a defined window. Neither filing links a buyer's first character to their second or provides comparable regional acquisition costs, and the window behind Bloks' repurchase rate is unspecified. Neither company has commented on dropshipping.
Where RyanFulfil fits
Who bought your second product is your question, and it is answered in your Shopify export, not by a sourcing agent. Where the China side helps is the moment the answer is "the same customers, and they want the next one": we can confirm the second product is the exact version you approved rather than a cousin of it, sample it, check the packing, and quote it two ways, in the same parcel as a reorder of the first product and on its own, because those are different costs.
Whether your customers come back, and whether a range is worth building, stays with you.
When your first buyers have told you what they want next, send us the exact product and the country and we will check the version, sample it and quote it both ways.
Find out who bought it before you build the range
POP MART can report a 23.8 per cent rise, name the character behind more than two thirds of it, and still leave every reader guessing whether those were last year's buyers. You do not have to guess. The join on your order list takes a week and answers the question the filing never does. So which is it in your store: customers, or a second launch you paid for twice? The sales table will agree with whichever answer you already want, so run the join before you pick one.
Here is how you would prove us wrong. If a store that builds a range straight off a second product's sales, without checking who bought it, keeps more profit once refunds have settled than one that runs the join and the split first, this guide is wrong. Run them on your next launch, then say which one paid: the store that asked who bought it, or the store that just built.
Where the figures come from
Sources as of 4 September 2026. Company figures are from the documents linked in the text and listed below: POP MART's interim results announcement for the six months ended 30 June 2026, published on HKEXnews on 20 August 2026, and Bloks Group's interim results announcement for the same period, published on 12 August 2026.
The 68.6 per cent share, 7.7 per cent growth without Twinkle Twinkle, 11 per cent and 58 per cent offsets and RMB4.48 per unit are calculated from the companies' reported amounts. POP MART's repeat rate uses the company's own definition, and its Asia Pacific and Americas explanations are the company's own, reported here in our words; the two companies define their customer figures differently and they are not comparable with each other.
The company figures show why a sales table cannot answer the question. Use the join, split test, five-outcome check and worksheet to test your own launch. The 1,000-buyer example is illustrative, not a benchmark; the noise boundary is a rule of thumb, not a statistical test. No product mentioned is a recommendation, and this is not investment research or an opinion on any share. Re-read it when POP MART publishes its full-year result, or when your own second launch has ninety days of settled orders behind it.
Need a product checked before you spend on ads?
Send us the product link and destination on WhatsApp (+86 178 4666 9989). We'll check sourcing, packing and shipping with you before you commit.
Get Sourcing Quote on WhatsApp →